13 Key Customer Engagement Metrics Your Business Should Measure
- February 7, 2022
- 18 mins read
- Listen

Engaged customers are always the lifeblood for businesses. They are the reasons why brands grow and thrive. And companies that measure the engagement level often deliver great experiences to customers.
It’s thus fair to say that, all your engagement effort would count for nothing if you did not measure the way customers engaged with your brand.
You must continuously track customer engagement metrics. Since customers can engage through different channels, it’s important to track metrics from them all to get a bird’ eye view of the audience.
Whether social channels, blogs, videos, newsletters, or forums, you need to know where and how the engagement happens. And when you regularly track or measure your customer engagement, it gets you tons of useful information that you can use to improve your offers and grow the business.
In this post, we will discuss metrics for customer engagement and how to measure engaged customers for your business.
Benefits of Tracking Customer Engagement Metrics
Tracking customer engagement metrics is key to getting a detailed view of what’s making people stick with or leave your brand. By using the data from the way people connect with your business, you can improve the engagement strategies for your customers. After all, 86% of buyers won’t mind paying more for a better experience and engagement.
Tracking customer engagement metrics can give a range of benefits, including –
- Understand your customer sentiment – Measuring customer engagement model success metrics can help you understand how people view your brand, your product, or your service. It will give a good picture of customer sentiment about your business.
- Identify your strengths and weaknesses – When you track engagement metrics, you basically do a SWOT analysis of your business where you come to know the strengths and weaknesses. With data in hand, you can be aware of the areas to improve customer experience and offer value.
- Adopt a more strategic approach – You can adopt a more strategic approach to customer experience only when you track metrics to measure customer engagement. With customer data for help, you will be in a better position to design a strategy that helps you better engage customers.
- Improve your decision-making – With regular tracking of customer engagement metrics, you could easily see the areas to need attention and then commit resources over there. This is how you can leverage data and improve decision-making with various aspects.
Some of Important Customer Engagement Success Metrics to Track
Engagement metrics are always an important indicator to see how your business is faring in terms of dealing with customers. And when you want to understand what ticks with customers, there is no better way than to track the way they engage with your brand. There are many important customer service KPIs and metrics you should track
Your business needs to measure many different metrics to understand customer engagement a bit better.
- Net Promoter Score (NPS)
- Customer Satisfaction Score (CSAT)
- Customer Lifetime Value (CTLV)
- Number of Active Users
- Customer Engagement Score (CES)
- First Week Engagement
- Social Media Engagement
- Stickiness Metrics
- Conversion Rate
- Pages Per Session
- Average Session Duration
- Bounce Rate
- Churn Rate
Tracking key metrics is always a powerful tool to get a deep insight into how users interact and engage with your brands. They are also of great help to understanding customer needs better.
Let’s look at each of these customer engagement metrics in detail –
1. Net Promoter Score (NPS)
Loyal customers often refer your product or service to other people. They say nice things about your business. And such clients are more likely to recommend your products to family or friends.
But how will you know which customers are more likely to recommend your products?
The NPS metric can help you do that. It’s used to know the willingness level of customers to promote your product or spread the word is known as the NPS (Net Promoter Score).
That’s why brands need to find ways to improve net promoter score and ensure more loyalty.
With NPS, you will know –
- How satisfied your customers are with your brand
- Whether your engagement efforts are going right
Plus, it’s easy to collect this metric through in-app surveys or email campaigns. When you collect the NPS through in-app surveys, it will give better and contextual responses.
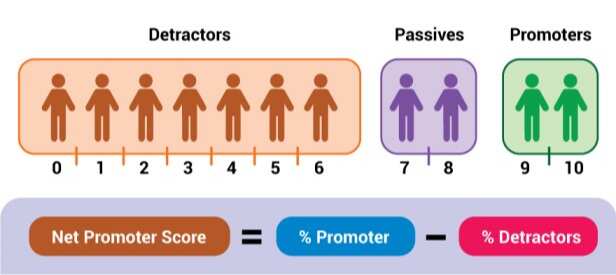
How to calculate NPS?
- Send surveys to existing customers after they have interacted with your product or service.
- Rate the response on a scale of 0 to 10. This will help you know the likely promoters and likely detractors.
- Apply the formula of NPS = % Promoters – % Detractors.
2. Customer Satisfaction Score (CSAT)
Happy customers bring value. They drive sales. The more of them you have, the more it shows how your engagement effort is going on the right track.
But how would you know whether a customer is happy with your company?
The CSAT helps track how pleased or satisfied your customers are with a product or service. It could also indicate the satisfaction level with any type of engagement or interaction a customer has with your brand.
By tracking this metric, you can improve customer satisfaction and provide great experiences.
In a CSAT survey, you ask the customer –
- How satisfied they are with the latest interaction
- How pleased are they with the company or a recent purchase or call quality of agents etc
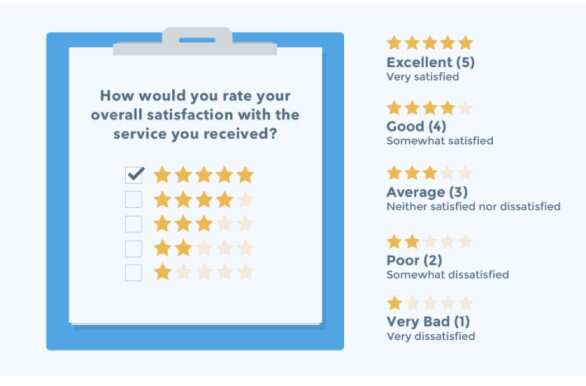
Quite like NPS, you can use a rating scale at the end of a survey where you can assign values between 1 to 5 to customer responses.
How to calculate CSAT?
- Ask customers a question like “How would you rate your experience with us?” and then add a numbered scale with the options.
- Divide the number of satisfied customers with the total survey responses.
- CSAT Score = Number of satisfied customers/ Number of survey responses
- You can customize the question or ask follow-up questions if you look to know more from the interaction.
3. Customer Lifetime Value (CTLV)
You already know how acquiring new customers is some five to seven times costlier than retaining the existing ones. And you’re three-time more likely to sell to existing or repeat customers than to new ones.
This clearly shows how retaining customers has a direct effect on revenue. The longer you make a customer stay, the more profitable you become.
And when you want to know how much value a customer brings over their entire stay, there is the CTLV metric for help.
The higher the CTLV score, the more a customer spends with your business.
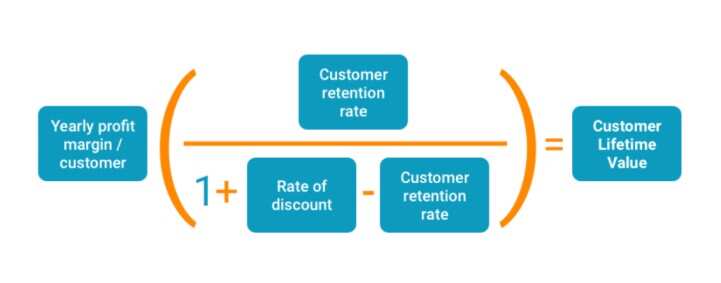
How to calculate CLTV?
- You first need to find the lifetime value
- LTV = Average Purchase Value × Number of Transactions × Retention Period
- Once you get this value, you can use it to get the customer lifetime value
- CLTV = LTV × Profit Margin
4. Number of Active Users
As a business, you need to keep track of how many users engage with your service or product in a particular time period. This kind of metric is very helpful in getting a broad view of how your engagement effort is working.
And when we talk of active users, we have two categories –
- DAU ( Daily Active Users) – It refers to unique users of a product or service per day.
- MAU (Monthly Active Users) – It refers to total users within a month.
Both DAU and MAU are quite a helpful customer engagement metrics to know the variation of users between a specific time frame. And you can always know the fluctuations and design your customer engagement strategies.
How to calculate DAU and MAU?
- To calculate customer engagement success metrics, you need customers who stick with your brand.
- Now, compare your daily active users with monthly data to get this metric.
5. Customer Engagement Score (CES)
When it comes to measuring engagement, existing customers are not the only criterion. Trial-period users or those who engage but may or may not convert could also be great customer engagement examples for your business.
While you may have a range of metrics to evaluate existing customers, should not you also track those in the trial stage or those not-so-sure to convert?
This is where the customer engagement score metric can help.
This metric can give a good idea of the engagement of your entire customer base. You can understand the areas to further work upon or evaluate the strategies of your already-used strategies.
When you measure customer engagement score, you will have to focus on each activity a user can perform, be it their social likes, comments, shares of your brand, etc.
This model is ideal for SaaS-based businesses as they have lots of customers in the trial period.
How to calculate customer engagement score?
- You can measure customer engagement metrics by using the online behavior and interactions with your products, service or website
- You can assign a weight score to each action
- Re = Random; N. = Number of occurrences
- CES = R1N1 + R2N2+ ……RtNt
- Analysis of customer engagement will give a good idea about customers willing to move further down the journey, or about those not ready to move to the next level.
6. First Week Engagement
Losing a lot of customers in the first week itself is not uncommon for service or subscription-based companies. It’s always a big challenge to keep users hooked through the first seven days and somehow move them down the funnel.
For such businesses, the first-week engagement is a good metric to know the success of their engagement strategy. This metric measures the rate at which a user interacts or ditches a service or product in the first week of use.
When you use this metric, you will easily know the effectiveness of customer engagement tools and the effort you employ.
The first-week engagement metric can help you track –
- How easy is your product or service to use
- How effective is your onboarding process
- How much your customer service is adding value
To achieve healthy first-week customer engagement metrics, you need to make sure –
- You deliver a great user experience (UX)
- Your product is largely free of glitches
- Your onboarding process is hassle-free and the product is easy to set up
- Your pricing structure is in sync with the value offered with each package
7. Social Media Engagement
People love social media. They use it a lot to discuss brands, products, and services all the time. From Facebook to Instagram, Twitter, and LinkedIn, the story is the same for these platforms.
In fact, social channels impact businesses in a big way and are now a vital part of the customer engagement strategy. For brands big and small alike, these channels are a great way to engage, interact and connect with customers.
Each platform may be unique in terms of demographics or messaging style but they are always a great source of data. Each of them provides a lot of metrics to understand customer engagement in detail.
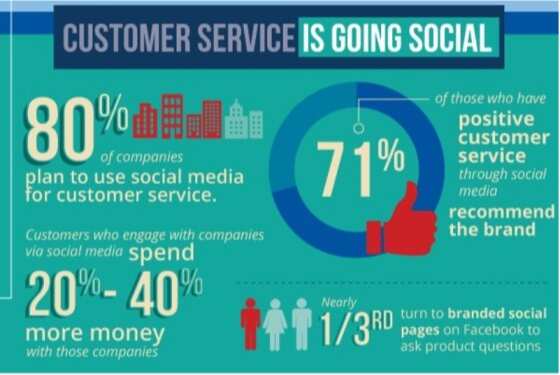
And when you track social media engagement, you understand engagement through users’ posts, mentions, likes, shares, etc. Maybe that reason, 63% of top marketers use KPIs to develop a detailed view of customers.
How to measure social media engagement?
- You can use some of the popular social media management tools like Hootsuite or Zoho and manage interactions successfully.
- You can use tools like Google Analytics, Twitter Analytics, Facebook Insights, etc to get a detailed view of how customers are engaging and interacting with you.
8. Stickiness Metrics
Who does not like sticky customers! The more you have ’em, the better. Yeah, they’re always an asset to any business. And only effective customer retention strategies can make people stick with you forever.
With such customers, you’re sure they won’t switch over to competitors. You’re sure they will keep coming. You can sell them premium services easily and can upsell and cross-sell them as well. Their stickiness can help reduce your marketing budget as well.
And with the “stickiness” metric, you can measure the level of happiness customers feel with your products or service. It can also help you know how likely customers are to continue using your products.
With stickiness metric –
- You will get an idea about whether your engagement strategy is working fine
- You will understand what is working in favor and what is not in terms of engagement
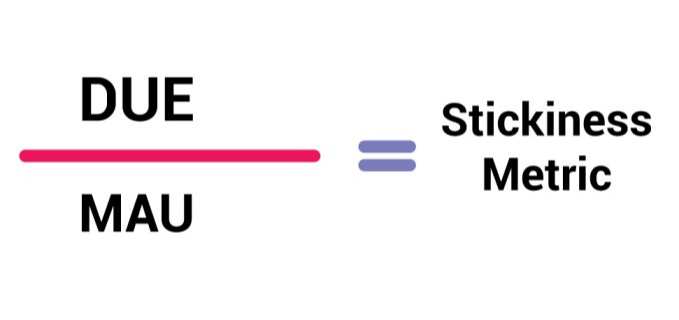
How to calculate stickiness metrics?
- To figure out the stickiness metric, you need to look at the DAU ( daily active users) and MAU (monthly active users)
- Stickiness = DAU ÷ MAU
9. Conversion Rate
Getting users to do what you want is often a great indicator of the success of a marketing campaign. And when you have made users do that, you know your engagement effort has paid off.
For that reason, when it comes to measuring customer engagement, there is nothing as powerful a metric as conversion rate. It tracks the percentage of people who complete a certain action tied to your marketing campaign.
Depending on the industry rate, conversion rate could be measured for many various things be it email newsletter sign up, eBook download, Facebook ad click,s and so on.
For some, visitors landing on the website’s pricing or product page could be a conversion while for some, it could be the users registering for a free trial for the product.
Based on the campaign, conversion goals can also vary as not every business has the same product line.
How to calculate conversion rate?
- Calculating the conversion rate is easy and you need the data related to the total number of conversions and visitors for the same
- Conversion Rate = Total number of conversions/ total number of visitors x 100
- You can also use marketing automation software if you don’t want to do the calculation part all by yourself
10. Pages Per Session
As a marketer, you’d ideally like people to come to your website and visit more pages per session. And when they do, it shows your content is engaging, informative, and helpful.
However, if users mostly click away just after landing on the website, it shows your content lacks value. It also indicates how you need to choose the right customer engagement platform and improve their value.
The pages per session engagement metric are always helpful for measuring the number of pages a user clicks through within a single visit.
- A high-per-session rate shows your website is delivering value
- A low page-per-session denotes your content is not up to the mark for the target audience
And when you have a low page-per-session rate, it could be due to many reasons, including –
- Faulty structure of internal links
- Poor website navigation
- Substandard content quality
You can use Google Analytics to measure pages per session.
11. Average Session Duration
Session time is one of the most-tracked metrics for customer engagement. It’s a key metric and almost everybody tracks it.
Tracking this metric is important because it shows whether or not website visitors have a long session on your blog or landing page in a single visit. It also shows the effectiveness of your customer service communication.
However, you also understand how not all pages in a website or on a blog evoke similar responses from visitors. While some pages might keep them hooked for longer, there will always be pages that don’t get much attention at all.
With the average session duration, you get to know –
- The type of content most valuable to your target audience
- Your products or services users are most interested in learning about
- The type of content you need to create to achieve a longer session time
The data you receive from tracking the average session time can be used to create new campaigns and content that cater to the pain points of users and ensure higher conversion rates.
You can rely on Google Analytics to track session times for all your pages automatically.
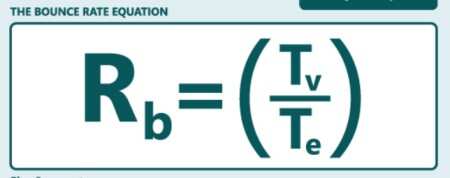
12. Bounce Rate
People always look for value. And when they don’t get it on your website, they will bounce to competitors. Would you want that to happen?
By the way, there is the bounce rate metric to know the percentage of people who exit your site after viewing only one page. The lower the bounce rate, or the more you reduce the bounce rate, the better it will be for your business.
The bounce rate metric is a good indicator to know –
- The quality of your website content
- The UX of your website
- The appeal level of your offers
- The differentiation factor of the website
If your site’s bounce rate is high or if your visitors are not clicking on different pages at all, it clearly shows people are not interested in your content.
In fact, a high bounce rate can point to many issues with your site such as bad user experience, irrelevant content, or slow page loading times
If you use Google Analytics, you’re good to calculate the bounce rate metric.
13. Churn Rate
Every company experiences churn. It’s the natural cycle of losing and acquiring customers. No matter how great you think you deliver service, product, or customer experience, some churn is almost inevitable. In fact, 1 in three customers will leave a brand with just one poor experience.
The churn rate metric can help you know the rate at which customers stop doing business with your business over a period of time. The lower the churn rate, the more customers you keep.
If you’re a SaaS company, the churn rate may indicate –
- The number of subscribers who cancel a subscription or don’t renew
- How, why, and where your customers may be churning
Churn is something you just can’t prevent. You however can know the signs, assign the resources and ensure value to customers to reduce the churn rate.
How to calculate the churn rate?
- You need the data of total customers at the start of a month and the total at the end of the month to calculate the churn rate
- Churn rate = the difference between the total customers at the end and the start of the month/ the total number of customers at the beginning of the month
How Can REVE Chat Help with Measuring Metrics for Customer Engagement?
REVE Chat understands how customer communication has to be prompt whether for sales, marketing, or support. We also realize the role of delivering smooth engagement and great experiences in winning or retaining customers.
With our AI-powered chatbot, you can automate customer communication and add a new dimension in CX.
The bot will help you boost customer engagement through 24×7 availability, consistency in responses, personalization, and omnichannel messaging. It can also help a lot when you search for metrics to measure customer engagement.
Plus, you can also integrate the bot with a live chat software solution and strike a perfect balance between automation and human support.
Using chatbot and live chat in combination can prove very helpful in getting insight into customers’ behaviors and preferences. It can therefore bring you the much-needed customer engagement metrics.
Final Thought
Measuring the engagement level of your customers is always the first step towards understanding where your business is doing right or wrong.
And when you know how much customers are engaged with your products or service, you can always serve them better.
In your effort of tracking customer engagement metrics, REVE Chat helps you start a free trial of chatbot.
And with the right tools by your side, you won’t find much trouble in measuring customer engagement metrics and employing resources to win more customers.