


Handover & Escalation Report
- November 1, 2026
- 2 mins read
Table of Content
Path: Reports → AI Agent Report → Handover & escalation
The Handover & escalation report helps you understand when customer conversations move from an AI Agent to a human support agent or another transfer destination.
It provides visibility into transfer volumes, successful transfers, waiting times, and transfer destinations.
This information is useful for evaluating how AI-powered support and human assistance work together.
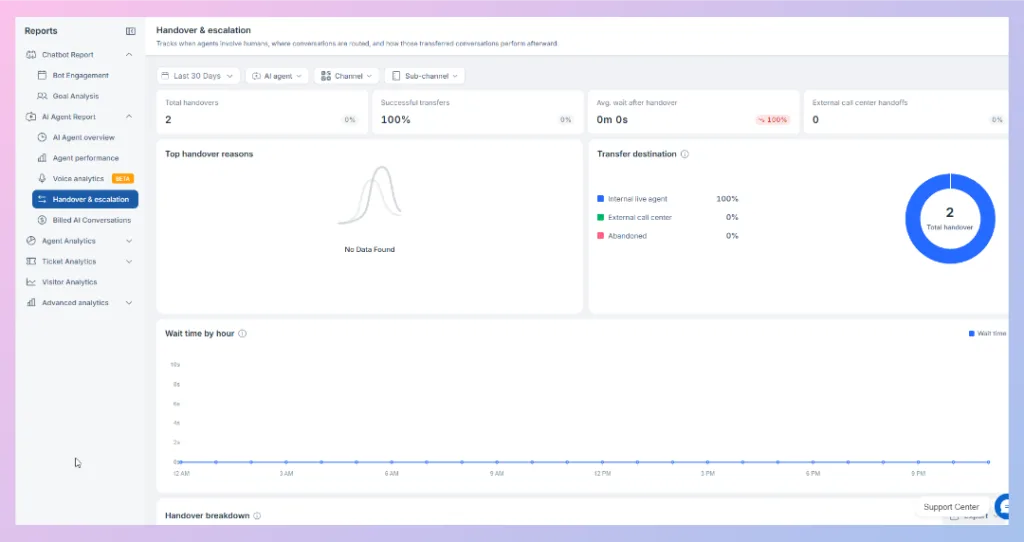
Understanding Handover Metrics
The dashboard displays four main indicators.
| Metric | Description |
|---|---|
| Total handovers | Total number of handovers recorded in the selected period. |
| Successful transfers | Percentage of handovers completed successfully. |
| Avg. wait after handover | Average waiting time following a handover. |
| External call center handoffs | Number of recorded transfers to external call centers. |
| Number of recorded transfers to external call centers. |
Example:
If an AI Agent transfers 20 customer conversations to human support and 19 transfers complete successfully, the successful transfer rate is 95%.
This helps businesses monitor whether customers are successfully reaching human assistance when required.
Top Handover Reasons
The Top handover reasons section is intended to help you identify why AI Agent conversations are transferred.
For example, a handover may be needed when a customer requests human assistance or when a task requires action outside the AI Agent’s available capabilities.
Reviewing handover reasons can help you identify recurring customer needs and opportunities to improve AI Agent configuration.
Transfer Destination
The Transfer destination chart shows where conversations go during handover.
The dashboard includes three categories:
| Destination | Description |
|---|---|
| Internal live agent | Conversations transferred to a human agent within the support team. |
| External call center | Conversations transferred to an external call center. |
| Abandoned | Transfers categorized as abandoned. |
| Transfers categorized as abandoned. |
The chart shows both the number of handovers and the percentage associated with each destination.
For example, the provided dashboard shows two handovers, with 100% routed to internal live agents.
This helps businesses understand how transferred conversations are distributed.
Wait Time by Hour
The Wait time by hour chart displays handover waiting times across different hours of the day.
It can help you identify periods when customers experience longer waits after being transferred.
How to use this report
If waiting times increase during specific hours, review human agent availability and staffing during those periods.
For example, a business may notice higher waiting times in the evening when fewer support agents are available.
This information can help improve support scheduling and reduce customer waiting times.
Handover Breakdown
The dashboard also includes a Handover breakdown section below the waiting-time chart.

 Start free trial