


AI Agent Overview
- October 28, 2026
- 3 mins read
Table of Content
Path: Reports → AI Agent Report → AI Agent overview
The AI Agent overview provides a summary of your AI Agent activity across text and voice interactions. It helps you understand how frequently customers engage with your AI Agents and how effectively those interactions support your business goals.
This section contains performance indicators, activity trends, channel distribution, and goal performance details.
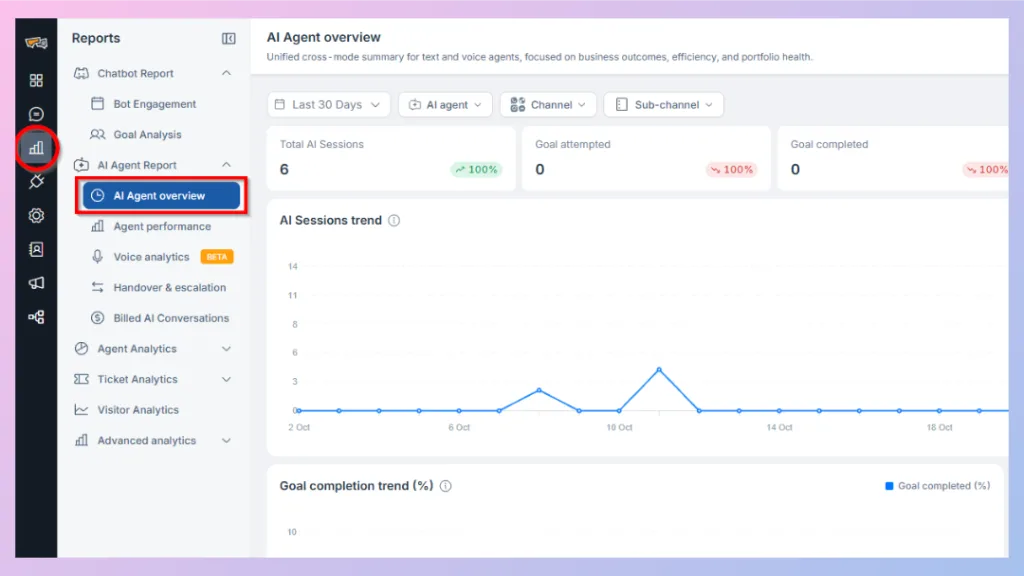
3.1 Understanding the Key Performance Indicators
At the top of the dashboard, five summary cards display important AI Agent metrics.
| Metric | Description |
|---|---|
| Total AI Sessions | Total number of AI Agent sessions recorded during the selected period. |
| Goal attempted | Number of times an AI Agent attempted to complete a defined business goal. |
| Goal completed | Number of successfully completed goal attempts. |
| Human transfer rate | Percentage of AI sessions transferred to human support agents. |
| Qualified leads | Number of qualified leads recorded through AI Agent interactions. |
Example:
Suppose your AI Agent has handled 100 customer sessions, attempted 40 defined goals, successfully completed 30, and transferred 20 sessions to human agents.
These indicators help you understand the volume of customer interactions, progress toward your business goals, and the level of human assistance involved.
The percentage indicators displayed beside some metrics show changes relative to another reporting period.
3.2 AI Sessions Trend
The AI Sessions trend chart displays how the number of AI Agent sessions changes throughout the selected date range.
- The horizontal axis represents dates.
- The vertical axis represents the number of AI sessions.
- The plotted line shows changes in AI Agent activity over time.
How to use this report
This chart helps you identify busy periods, monitor changes in customer engagement, and understand whether AI Agent usage is increasing or decreasing.
For example, if your AI Agent experiences a sudden increase in sessions during a promotional campaign, you can use this chart to observe the change in customer activity.
3.3 Goal Completion Trend (%)
The Goal completion trend (%) chart shows how goal completion performance changes over time.
A goal represents a specific business outcome that an AI Agent is expected to achieve, such as helping a customer with a product recommendation or completing a configured support task.
This chart helps you identify periods when your AI Agent successfully achieves its defined goals.
How to use this report
Review the trend to determine whether your AI Agent is consistently achieving its goals or whether performance varies across different dates.
If goal completion is low, review the AI Agent’s instructions, knowledge sources, available tools, and goal configuration to identify possible improvements.
3.4 Channel Mix
The Channel mix chart shows how AI Agent sessions are distributed across communication channels.
It presents:
- The channels generating AI Agent sessions.
- The number of sessions associated with each channel.
- The percentage of total sessions contributed by each channel.
For example, the provided dashboard shows seven sessions from the Web channel, representing 100% of the recorded sessions.
This information helps businesses understand where customers interact with their AI Agents most frequently.
3.5 Goal Performance Snapshot
The Goal performance snapshot provides a more detailed view of individual business goals.
Instead of showing only the total number of completed goals, this table helps you understand how each configured goal performs.
| Column | Description |
|---|---|
| Goals | Name of the configured business goal. |
| Goal attempted | Number of attempts recorded for that goal. |
| Goal reached | Number of attempts that successfully reached the goal. |
| Completion rate | Percentage of attempts that successfully reached the goal. |
| Human transfer | Percentage associated with human transfers for that goal. |
Example:
An ecommerce business may configure a goal called “Recommend suitable products.”
If the AI Agent attempts this goal 50 times and successfully completes it 35 times, the completion rate would be 70%.
You can use these results to identify which goals perform well and which require attention.
The table also provides sorting, pagination, and an Export option for further analysis.

 Start free trial