


Agent Performance Report
- October 28, 2026
- 2 mins read
Table of Content
Path: Reports → AI Agent Report → Agent performance
The Agent performance report helps you evaluate individual AI Agents and compare their results.
This is particularly useful when your business has multiple AI Agents handling different responsibilities, such as sales assistance, product recommendations, customer support, or account-related questions.
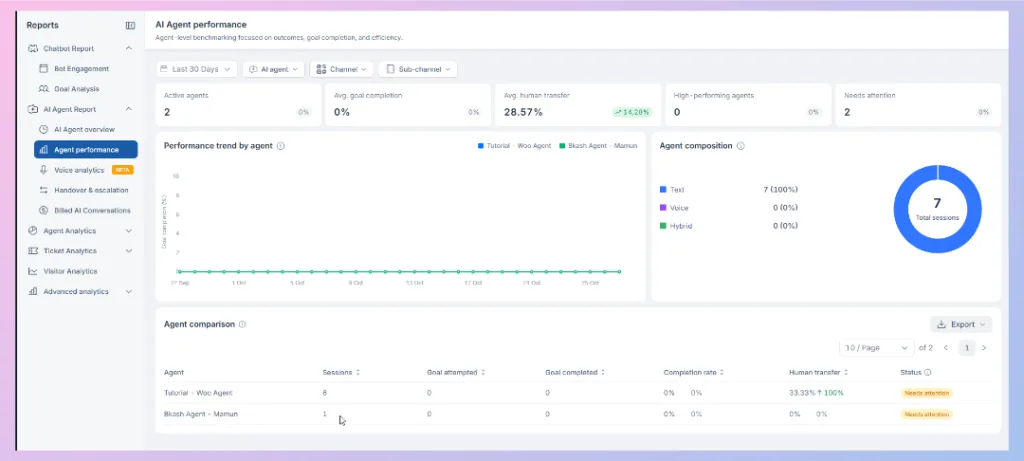
Agent Performance Summary
Five performance indicators appear at the top of this report.
| Metric | Description |
|---|---|
| Active agents | Number of AI Agents recorded as active in the selected reporting period. |
| Avg. goal completion | Average goal completion performance across the agents included in the report. |
| Avg. human transfer | Average human transfer rate displayed for the AI Agents. |
| High-performing agents | Number of AI Agents classified as high-performing by the reporting system. |
| Needs attention | Number of AI Agents identified as requiring performance review or improvement. |
These metrics provide a quick understanding of the overall performance of your AI Agent setup.
Important: An agent marked “Needs attention” should be reviewed, but the status alone does not explain the cause. The exact classification thresholds are not shown in the dashboard screenshots.
Performance Trend by Agent
The Performance trend by agent chart compares goal completion performance across individual AI Agents.
Each agent is represented separately, allowing you to monitor changes in its goal completion percentage over time.
How to use this report
Suppose your business has two AI Agents:
- A Sales AI Agent that helps customers find products.
- A Support AI Agent that answers delivery, return, and account-related questions.
You can compare their goal completion trends to understand which agent is achieving its assigned goals more consistently.
If one agent shows low performance, examine its assigned goals, knowledge base, instructions, and connected tools.
Agent Composition
The Agent composition chart displays the distribution of AI Agent sessions by interaction type.
The dashboard includes three categories:
| Type | Description |
|---|---|
| Text | Sessions handled through text-based interactions. |
| Voice | Sessions categorized as voice interactions. |
| Hybrid | Sessions categorized as hybrid interactions. |
The chart displays the number and percentage of sessions for each category.
This helps you understand the types of AI experiences your customers are using.
Agent Comparison
The Agent comparison table allows you to review multiple AI Agents side by side.
It includes:
| Column | Description |
|---|---|
| Agent | Name of the AI Agent. |
| Sessions | Number of sessions handled by the AI Agent. |
| Goal attempted | Number of goal attempts associated with the agent. |
| Goal completed | Number of completed goals. |
| Completion rate | Percentage of attempted goals completed successfully. |
| Human transfer | Percentage of sessions transferred to human agents. |
| Status | Performance classification assigned to the AI Agent. |
How to interpret the results
An agent with many sessions but few completed goals may require further review. However, check whether goals have been configured and attempted before treating a low completion rate as a performance problem.
Similarly, an agent with a high human transfer rate may be handling complex requests that require human assistance. Transfers are not necessarily unsuccessful outcomes.
You can sort the table using supported column headings, navigate through the available pages, and use Export to retrieve report data.

 Start free trial